Automatic segmentation of arteries in multi-stain histology images

TNT members involved in this project:
Nobody is listed for this project right now!
Show all

Coronary Heart Disease (CHD), also called Atherosclerotic Heart Disease or Coronary Artery Disease (CAD) is a serious disease that affects millions of people around the world and that is caused by the formation of plaque in the arteries. There are two common approaches for plaque determination:

  • Invasive, in-vivo imaging techniques such as intra-vascular ultrasound imaging (IVUS) , Optical Coherence Tomography (OCT) or Magnetic Resonance Imaging (MRI), which suffer from noise induced by dynamic motions and low resolution.

  • Microscopic histology imaging of samples ex-vivo, which has a much higher resolution and allows for a detailed study of the plaque morphology.
All the above techniques need an appropriate automatic segmentation tool to analyze large image databases in order to improve our understanding of the disease. Currently, relevant microscopy images are often analyzed manually, e.g. using Photoshop, a time consuming and error-prone process.

The present study focuses on the automatic segmentation (finding the Region of Interest or ROI) of stained microscopic images to analyze coronary plaque characteristics.

The artery

Basic parts of an artery, along with a brief description of each:

  • 1. Lumen: opening inside the artery where the blood flows.
  • 2. Intima: first layer, made of a single layer of endothelial cells. This is where the lipids are deposited to form an atherosclerotic plaque.
  • 3. Media: second layer, made of smooth muscle cells and elastic tissue.
  • 4. Adventitia: third and outermost layer, mainly composed of collagen which
  • 5. External Elastic Lamina (EEL)}: wall between the media and the adventitia.}
We are interested in capturing the plaque as well as the area of the artery. As the atherosclerotic plaque is formed in the intima, the target ROI can be found between the EEL (outer boundary of the ROI) and the contour of the lumen (inner boundary of the ROI).


The basic structure of our algorithm is shown in Figure 1. In a timely fashion, we can divide the algorithm in:

  • Creation of a color model from training data. This is computed just once. Marked in blue.
  • Finding the EEL using snakes with the information of the likelihood image and the inner boundary.
  • Feedback of the GUI which affects the inner boundary determination and the cleaning of the likelihood image. Marked in red.
An overview of the database

For this study we randomly selected 42 histological images from 4 different coronary artery types: Right Coronary Artery (RCA), Left Circumflex Artery (LCX), Left Anterior Descending Artery (LAD) and Obtuse Marginal Artery (OM) within a total of 33 arteries from 11 different pigs. We focus on images created with the stains:
  • Verhoeff: darkens the structural elements of the artery (IEL, EEL). We use these images to find the initial ROI.
  • Oil Red O: shows in bright red the fat in the artery. We use these images to compute the total amount of plaque.% with respect to the area of the artery.
We then use color features to create a model from the training data.
Problem 1,3: color and shape differences -- Problem 2: marked in red

Our study faces 3 main problems with the images, as shown in Figure 2. Each one will be dealt with a specific method:
  • Color differences due to the staining process.
  • External tissue or stain spots that result in undesired white artifacts in the likelihood image.
  • Various shapes and sizes of the arteries.


PRE-PROCESSING

In order to compensate for color variability (problem 1), we decided to use histogram equalization. The obvious approach of using three different color models (pink, brown and purple) proved to give less consistent results in the end.

Inner boundary: region growing

To segment the inner boundary of the ROI, we use the region growing technique. We choose the seed manually and apply the algorithm on a grayscale image.

Statistical color model

The outer boundary of our ROI can be clearly identified by a dark color produced by the Verhoeff stain. Therefore, we model this color information and create a likelihood image that indicates where in the image it is likely to have an EEL.


MODEL TRAINING AND CREATION

To generate the statistical color model, we manually select N_t=15 boundary points on all the training images. We include in the model all the pixels in a window w of 11x11 centered in the selected boundary point.
A normalized histogram with M bins is created for each of the color components R, G and B of the pixels.

Likelihood image

In order to convert the histogram information to the pixels in the image space, we create what we call the likelihood image. As shown in the following Equation, we use a naive Bayes classifier to compute the probability of each pixel of the image.


According to the model, the likelihood image should be white in the boundary pixels and black elsewhere. In order to solve problem 2 (undesired white pixels in the likelihood image), we apply image reconstruction, using an eroded version of our image as the marker. One example is shown in Figure 3.


OUTER BOUNDARY: SNAKES AND SPLINES

In order to find the outer boundary of the arteries, we need an adaptive contour that is able to "ignore" the white artifacts that might still remain in some images but that is also able to "imagine" where the boundary is when the contour is not closed. We use snakes or active contours expressed using splines. The snakes allow us to "drive" our contour to the highest energy point. We use splines to exploit the fact that arteries have rounded shapes, so our contour must have a polynomial behavior where no sharp edges are possible. The snake is controlled by 15 break points (BP).

Automatic initialization

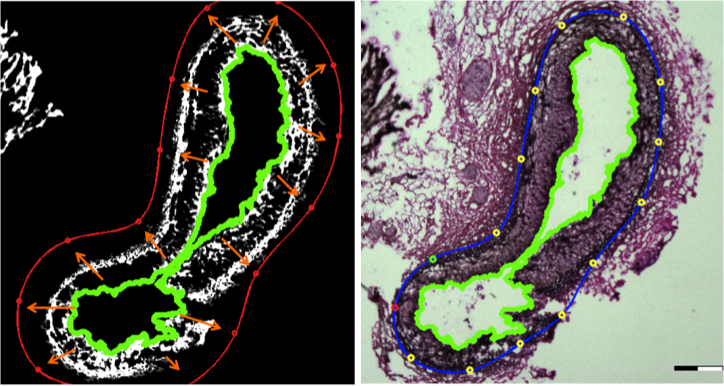
One of the most important steps to see our segmentation algorithm succeed, is finding a good initialization for the snake. The initialization depends on the shape and size of the artery (problem 3), therefore we need to use known contour information. Our approach is to use the inner boundary found previously using region growing. We start from the inner boundary (green) and dilate (orange arrows) the contour until we find that it is outside the EEL (red).


Energies that drive the snake

The energy functional of the snake is composed of three terms:
  • A smoothness term, equivalent to the second derivative, prevents oscillations and sharp edges.
  • A probability term which is the maximum intensity value of the likelihood image found in a 5x5 window centered in the point we are analyzing.
  • A spline term, found by sampling the segment from the i th BP to the i-1 th BP and the one from the i th BP to the i+1 th BP and finding the average intensity value of all these sample pixels.

To analyze the performance of our automatic algorithm, we consider the manual segmentation of the images as ground truth. We measure the error based on areas, comparing the number of pixels of the area found automatically and the number of pixels of the manually segmented area.


As we can see, we obtain statistically 54.8% of automatically segmented outer boundaries and 10% more with minimal user interaction.
From a user point of view, we can compute the average number of "mouse clicks" needed to segment an image as a measure of the workload of the user. 54.8% of the images are correctly analyzed with just one initial click (to choose the seed for region growing).
All the images can be analyzed with an average of 4.81 clicks.

SUMMARY

This project is focused on the problem of segmenting arteries in multi-stain histology images.
We propose an algorithm to automatically localize the artery and plaque within the image.
Our approach is based on the creation of a statistical color model from training data, which allows us to obtain likelihood images.
To find the outer boundary of the ROI in the likelihood images, we use snakes or active contours and minimize an error function which jointly optimizes a likelihood term, a smoothness term and a spline term. The initialization of the snakes is specially important to overcome the arteries shape differences and our solution is to use the inner boundary contour found by region growing. The overall algorithm achieves positive results that specially reduce the amount of time that the user spends analyzing the images.
We obtain 64.3% of automatically segmented arteries.
If we consider an average of 20 clicks to segment each image manually and compare it with our algorithm that allows the user to segment all images with an average of 4.81 clicks, we see that we reduce the user's work by 76%.
In the future, we plan to exploit the difference in texture between the media and the adventitia to make our algorithm more robust.

  • Conference Contributions
    • Laura Leal-Taixé, Ahmet U. Coskun, Bodo Rosenhahn, Dana H. Brooks
      Automatic segmentation of arteries in multi-stain histology images
      World Congress on Medical Physics and Biomedical Engineering, Munich (Germany), September 7th-12th, 2009